

A good management dashboard does not simply show as many graphs as possible. It helps people answer a question and choose a next step. AI can summarize information and help identify patterns, but the quality of an overview starts with reliable data and clear definitions.
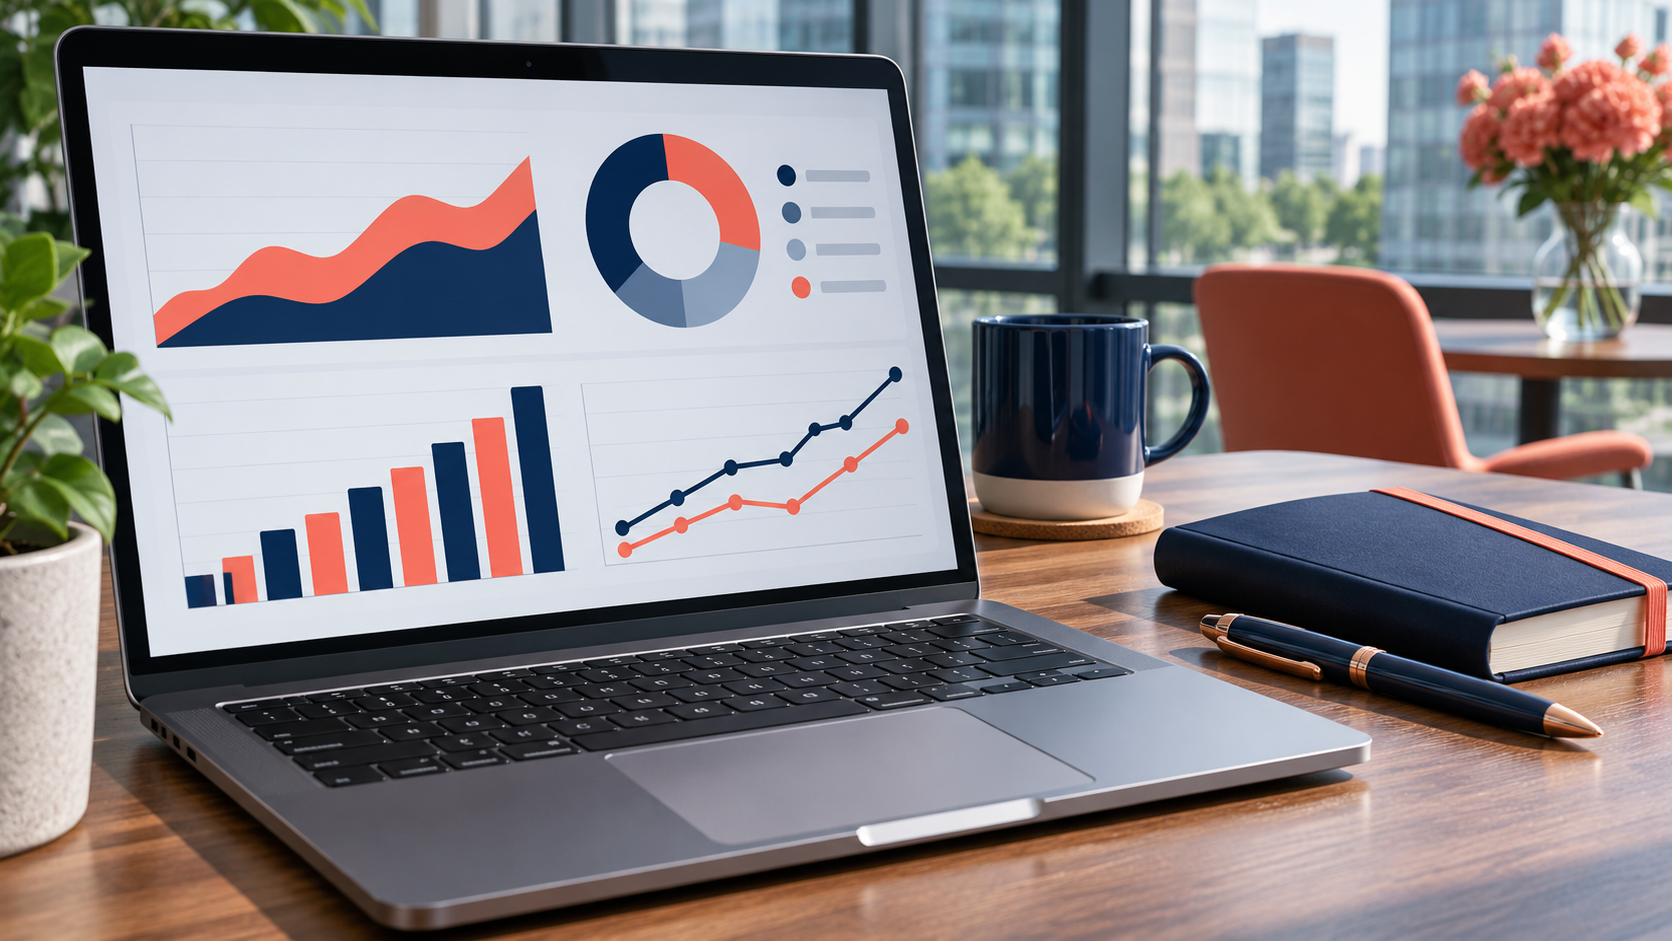
Start with decisions, not graphs
Ask in consultation what decision should be made. Does the team want to know which applications remain, where production is delayed or which stock requires attention? After that, choose a limited number of indicators. Agree on what each indicator means, what source it comes from, how often it is updated, and who is responsible.
What data is useful?
Possible sources are a job registration, webshop, stock Administration or production planning. A link depends on the available systems and access rights. First, check that data is complete and up-to-date and that duplicate registrations exist. A dashboard can clearly show inaccurate source data, but does not automatically correct it.
What can AI add?
For example, an AI application can prepare a periodic overview in plain language or highlight noticeable deviations. Such a signal is an invitation to investigate, not evidence of a cause. Have a person in charge review the underlying data before any conclusions or actions follow.

Make the overview useful for teams
Show the current status, the agreed standard and a clear owner for each subject. Make visible when the data was last updated. Keep details available to those who want to inquire and limit sensitive information to authorized users. Don't use color as the only way to indicate a status.
Testing a small dashboard
Choose one Management question and a maximum of a few indicators. Compare the overview with the source, discuss it during an existing consultation and note which questions remain unanswered. After that, adjust definitions and decor. This is how the dashboard grows with the organization.
Example: understanding overdue applications
Suppose a manager wants to know why requests remain. An initial overview can show the number of open tasks, the age of the oldest application and the distribution by team. Verify that all teams are using the same state and that closed requests are actually closed. Then compare the numbers with the actual files before drawing a conclusion.
An AI summary can suggest recurring comments or possible points of attention. A manager then examines together with the team whether, for example, capacity, missing information or a technical malfunction is involved. The dashboard supports that conversation; it doesn't take over the decision.
Prevent common pitfalls
Too many indicators make a screen difficult to read. An average can also hide differences between teams. Therefore, also show numbers, definitions and the period to which numbers relate. Check if a user can access the source from a summary and agree on how errors are reported. Periodically evaluate whether each indicator still helps in a real decision.
Watch with Digivance which reporting and links fit your processes.
Read also about AI Business Automation and Management at Digivance.